THE EIGHT INDICATORS
This page provides an overview of the Barometer’s indicators. Detailed guidance for governments and companies is available in the knowledge hub.
ACTION INDICATORS
1: POLICIES AND INSTITUTIONAL ARRANGEMENTS
Up to ten relevant policies and institutional arrangements that support restoration can be submitted when using the Barometer. And, if applicable, it’s also possible to report on the assigned budget for restoration, the defined target in terms of hectares, and the institution or department responsible for the restoration activities.
2: FUNDING
The funding in this indicator refers to the amount (given in USD) actually spent on restoration, not the amount promised.Different types of financial support for restoration include: Domestic public expenditure eg. public procurement of restoration services (e.g. environmental management of local governments), private investment e.g. Impact investors and blended capital, international donor supporte.g. Green Climate Fund and domestic philanthropic and non-profit.
3: TECHNICAL PLANNING
Effective planning to identify where, how and why restoration efforts will take place, and assess their potential benefits, is critical for ensuring long-term positive impacts and meaningful outcomes. This indicator helps record the restoration planning approaches adopted including:
-
-
- the geographic scale of planning, from site-specific to national level
- the spatial resolution used while conducting the planning process
- the initial condition and status of the landscape(s) covered
- how the planning process and approach addressed and assessed the potential benefits of restoration actions on biodiversity, particularly in terms of endangered species and their habitats
-
4: MONITORING SYSTEMS
This indicator supports the important process of systematically and consistently tracking ecosystem restoration including:
-
-
- whether proprietary monitoring systems are in place
- how systems were developed and applied, and whether they’re being used to report to multilateral environmental agreements or other international restoration initiatives
- whether monitoring systems and methodologies are part of a system to track and report emission reduction against national climate and development targets required under the Paris Agreement
- the investment and efforts dedicated to establishing such systems, methodologies and/or frameworks
-
IMPACT INDICATORS
5: AREA OF LAND
By defining the amount of land under active restoration, this indicator supports evaluation of how effectively pledges are being met. It’s measured in hectares under restoration, and in collaboration with Professor Jeff Sayer, IUCN has defined this as “the area (in hectares) where functionality (ability to provide ecosystem goods and services) has been improved by restoration (not only area of direct intervention)”.
Coordinates and/or geographic information systems (GIS) files showing the extent of the degraded ecosystems under restoration should be provided using manual data collection or spatial data from satellite imagery. Data produced via spatial analyses or ground surveys may vary in accuracy and should be categorised using the tier structure below.
6: CLIMATE
It’s clear that the benefits of ecosystem restoration extend beyond impacts on the land itself, and those who live on it. This indicator can be used to assess how ecosystem restoration can help mitigate the effects of the climate crisis though carbon sequestration. Estimating the amount of carbon sequestered needs to directly relate to the amount hectares under restoration, in accordance with standard IPCC accounting principles shown in figure three.
Under this method:
-
-
- activity data is the number of hectares under restoration (which should match indicator five)
- removal factor is the tonnes of carbon dioxide sequestered per hectare per year (tonnes of CO2 per hectares per year)
- activity data and removal factors should be grouped by restoration type to improve estimate accuracy
-
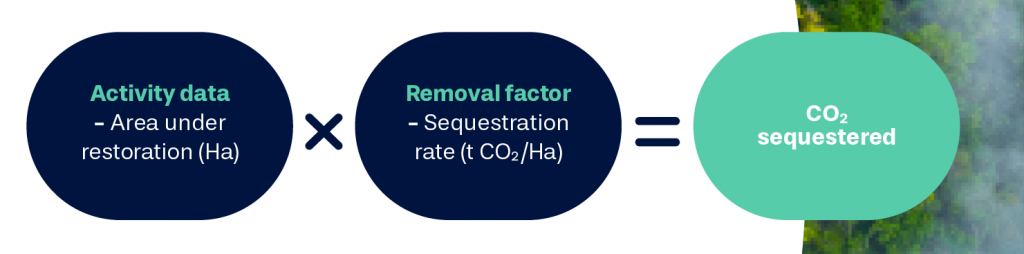
Figure: How CO2 sequestered from restoration activities in quantified
Source: IUCN/Yokedesign.studio
Estimates should reflect gross carbon sequestration (the total CO2 actually sequestered from the atmosphere, rather than potential emissions associated with the restoration activities, such as emissions from vehicles or methane emissions from livestock in silvopastoral systems).
If estimates on the actual and anticipated climate impacts of restoration activities have already been made through greenhouse gas (GHG) inventory systems to meet national reporting commitments like the United Nations Framework Convention on Climate Change (UNFCCC), then they should be used to ensure consistent reporting through this Barometer.
7: BIODIVERSITY
This indicator facilitates reporting on the benefits of ecosystem restoration on biodiversity, including:
-
-
- the creation or enhancement of corridors for endangered species or species of functional importance, such as pollinators
- the creation or enhancement of corridors across multiple-use landscapes to connect key habitats and allow for species dispersal
- the creation or enhancement of existing habitats for Red List species
- the reduction of dependence on wild species and/or their habitats in the buffer zones of protected areas
- how restoration efforts have benefited areas that have received formal recognition as an area of particular importance for conservation and biodiversity (e.g. Key Biodiversity Areas (KBAs), Protected Areas, National Parks) or in native, intact or primary forests
-
IUCN guidance is available to identify what constitutes an area of particular importance for conservation.
8: ECONOMY
Indirect advantages of ecosystem restoration, like diversification of livelihoods and income sources for local communities, need to be monitored as well as the direct benefits on local and national economies. But because of the length of time it can take for these benefits to manifest, the fact that some are less tangible than others, and the diverse range of people impacted, quantifying these socio-economic impacts can be difficult.
To address these challenges, this indicator uses the number of jobs created (expressed in Full Time Equivalent (FTE[2]) or workdays) for people aged 15 and over through restoration as the single indicator for socio-economic impacts. It also gives flexibility to report additional information on job creation where relevant, and add details on further impacts (i.e. as reports by beneficiaries or results from other studies).
Additional details on job creation should be provided when available, such as:
-
-
- job type (casual, short term, long term, or details about other types of employment)
- employee gender (male/female/third gender/non-binary/other)
- headcount of people who have been employed (which could be different to the number of jobs measured in FTE, for example with part-time employment)
-